Features

Inventory
& systems

- To represent the network and its characteristics.
- Know your asset portfolio and manage your inventory simply and reliably.
- To provide a clear view of the asset portfolio on a geographical map or on business-specific visuals.
Asset
strategies

- To model asset types (standard elements) and their nominal or alternative optimised lifecycle strategy (corrective, palliative).
- To model product policies and the effects of innovation.
Condition
diagnosis

- To make the most of asset condition and performance data from the field (IoT sensors, inspection reports, etc.).
- To adjust and optimise the asset maintenance and renewal plan.
Scenarios
and prioritisation


- To optimise maintenance and renewal programmes in line with resources and risks.
- To assess the short, medium and long-term impact of human, industrial and financial resource scenarios on the performance of your asset portfolio.
Indicators of the network status


- To quantify the condition, performance and level of criticality of your assets.
- To aggregate and format the language used by your organisation and external stakeholders.
- To industrialise the creation of reports, network status reports, etc.
Performance
change indicators


- To measure changes in the condition, performance and level of risk of your assets and network.
- To compare diverse budgetary or industrial scenarios and propose an optimised trajectory to your organisation and external stakeholders.
- To build asset management plans by asset family.
Traitement des données
- Connexion aux sources de données.
- Vérification de la consistance des données.
- Stratégie de transformation selon les besoins métier.
- Industrialisation du traitement grâce aux chaînes de traitement (pipeline) Python ou Power Query.


Analyse et connaissances
- Analyse de vos données, création ou mise à jour de vos règles métiers (durées de vie, fiabilité, etc.).
- Industrialisation grâce aux chaînes d’analyses Python et/ou Excel.
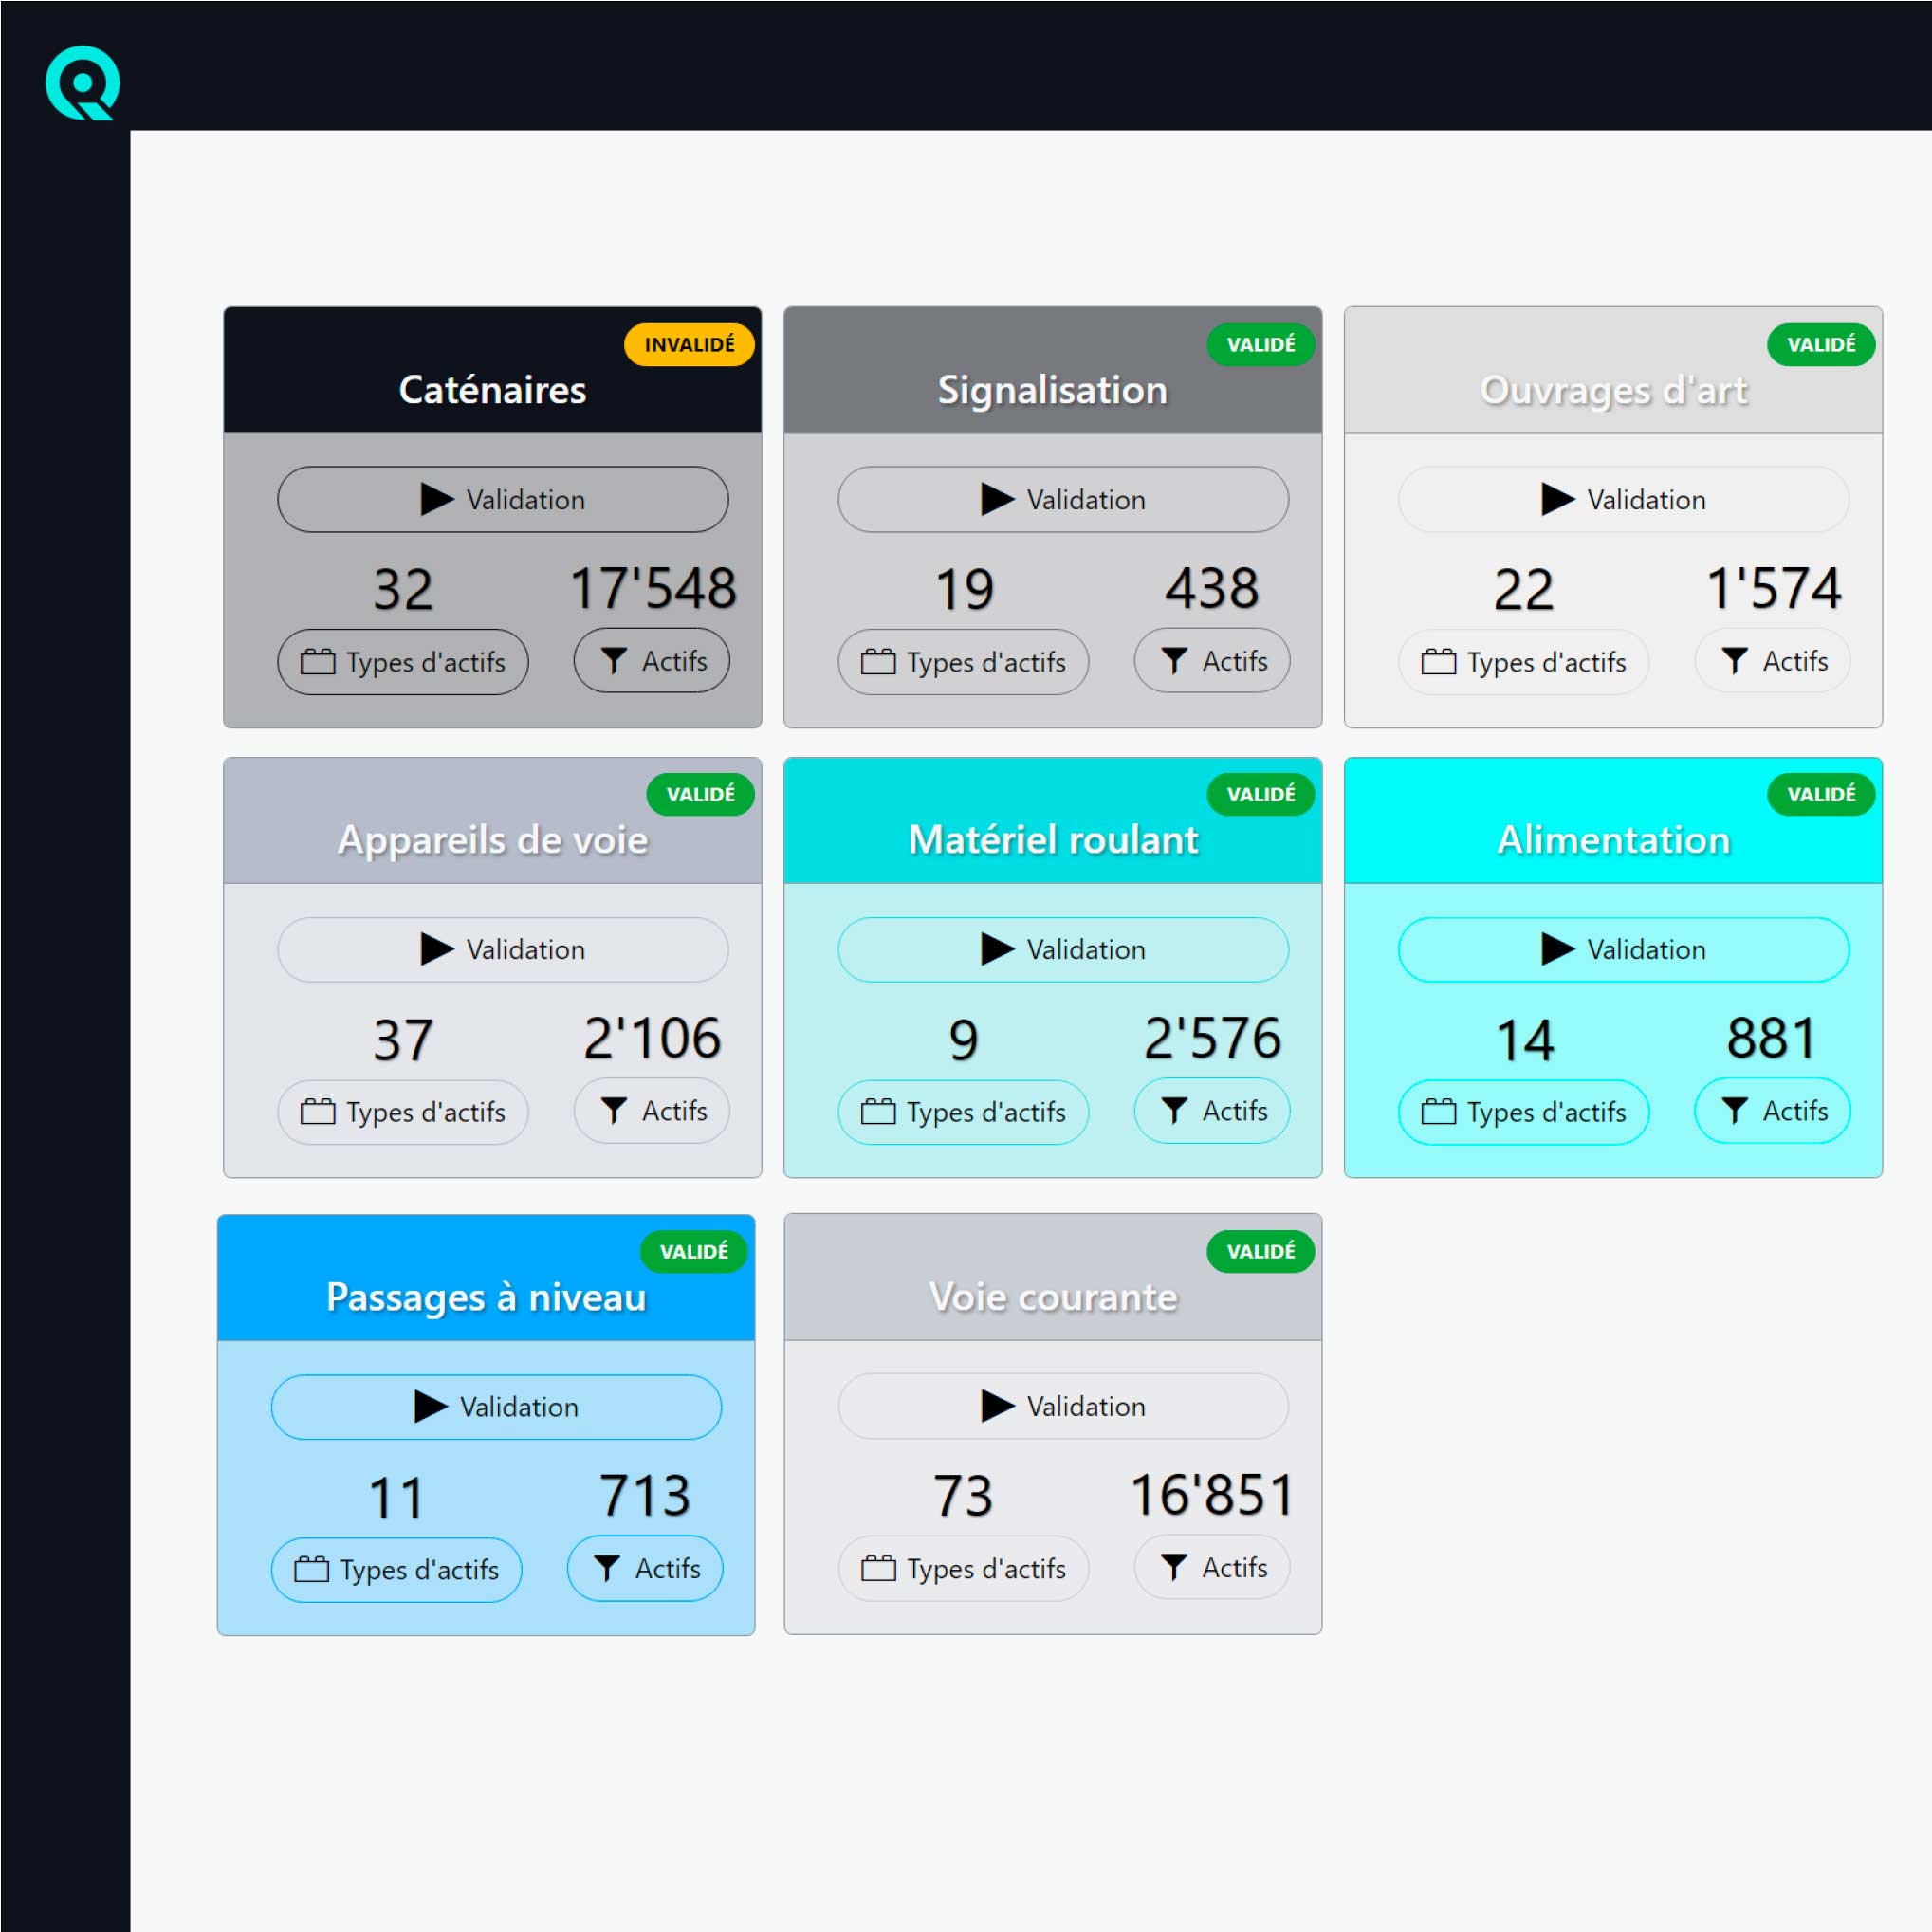
Inventory & systems
- Modelling of the network (rail, road, energy distribution, water distribution, etc.), its systems and its topo-functional structure
- Modelling homogeneous asset families and discretising the network
- Integration of punctual or linear assets
- Backup of assets, their type, size, installation date, actual condition, actual length of use, measured cumulative stress, observed unit cost and maintenance operations actually carried out.
- Short-term maintenance and regeneration programmes are taken into account
- Easy import/export of asset data in Excel format, guaranteeing great agility
- Independent inventory or interface with other business databases
- Locating assets on the network
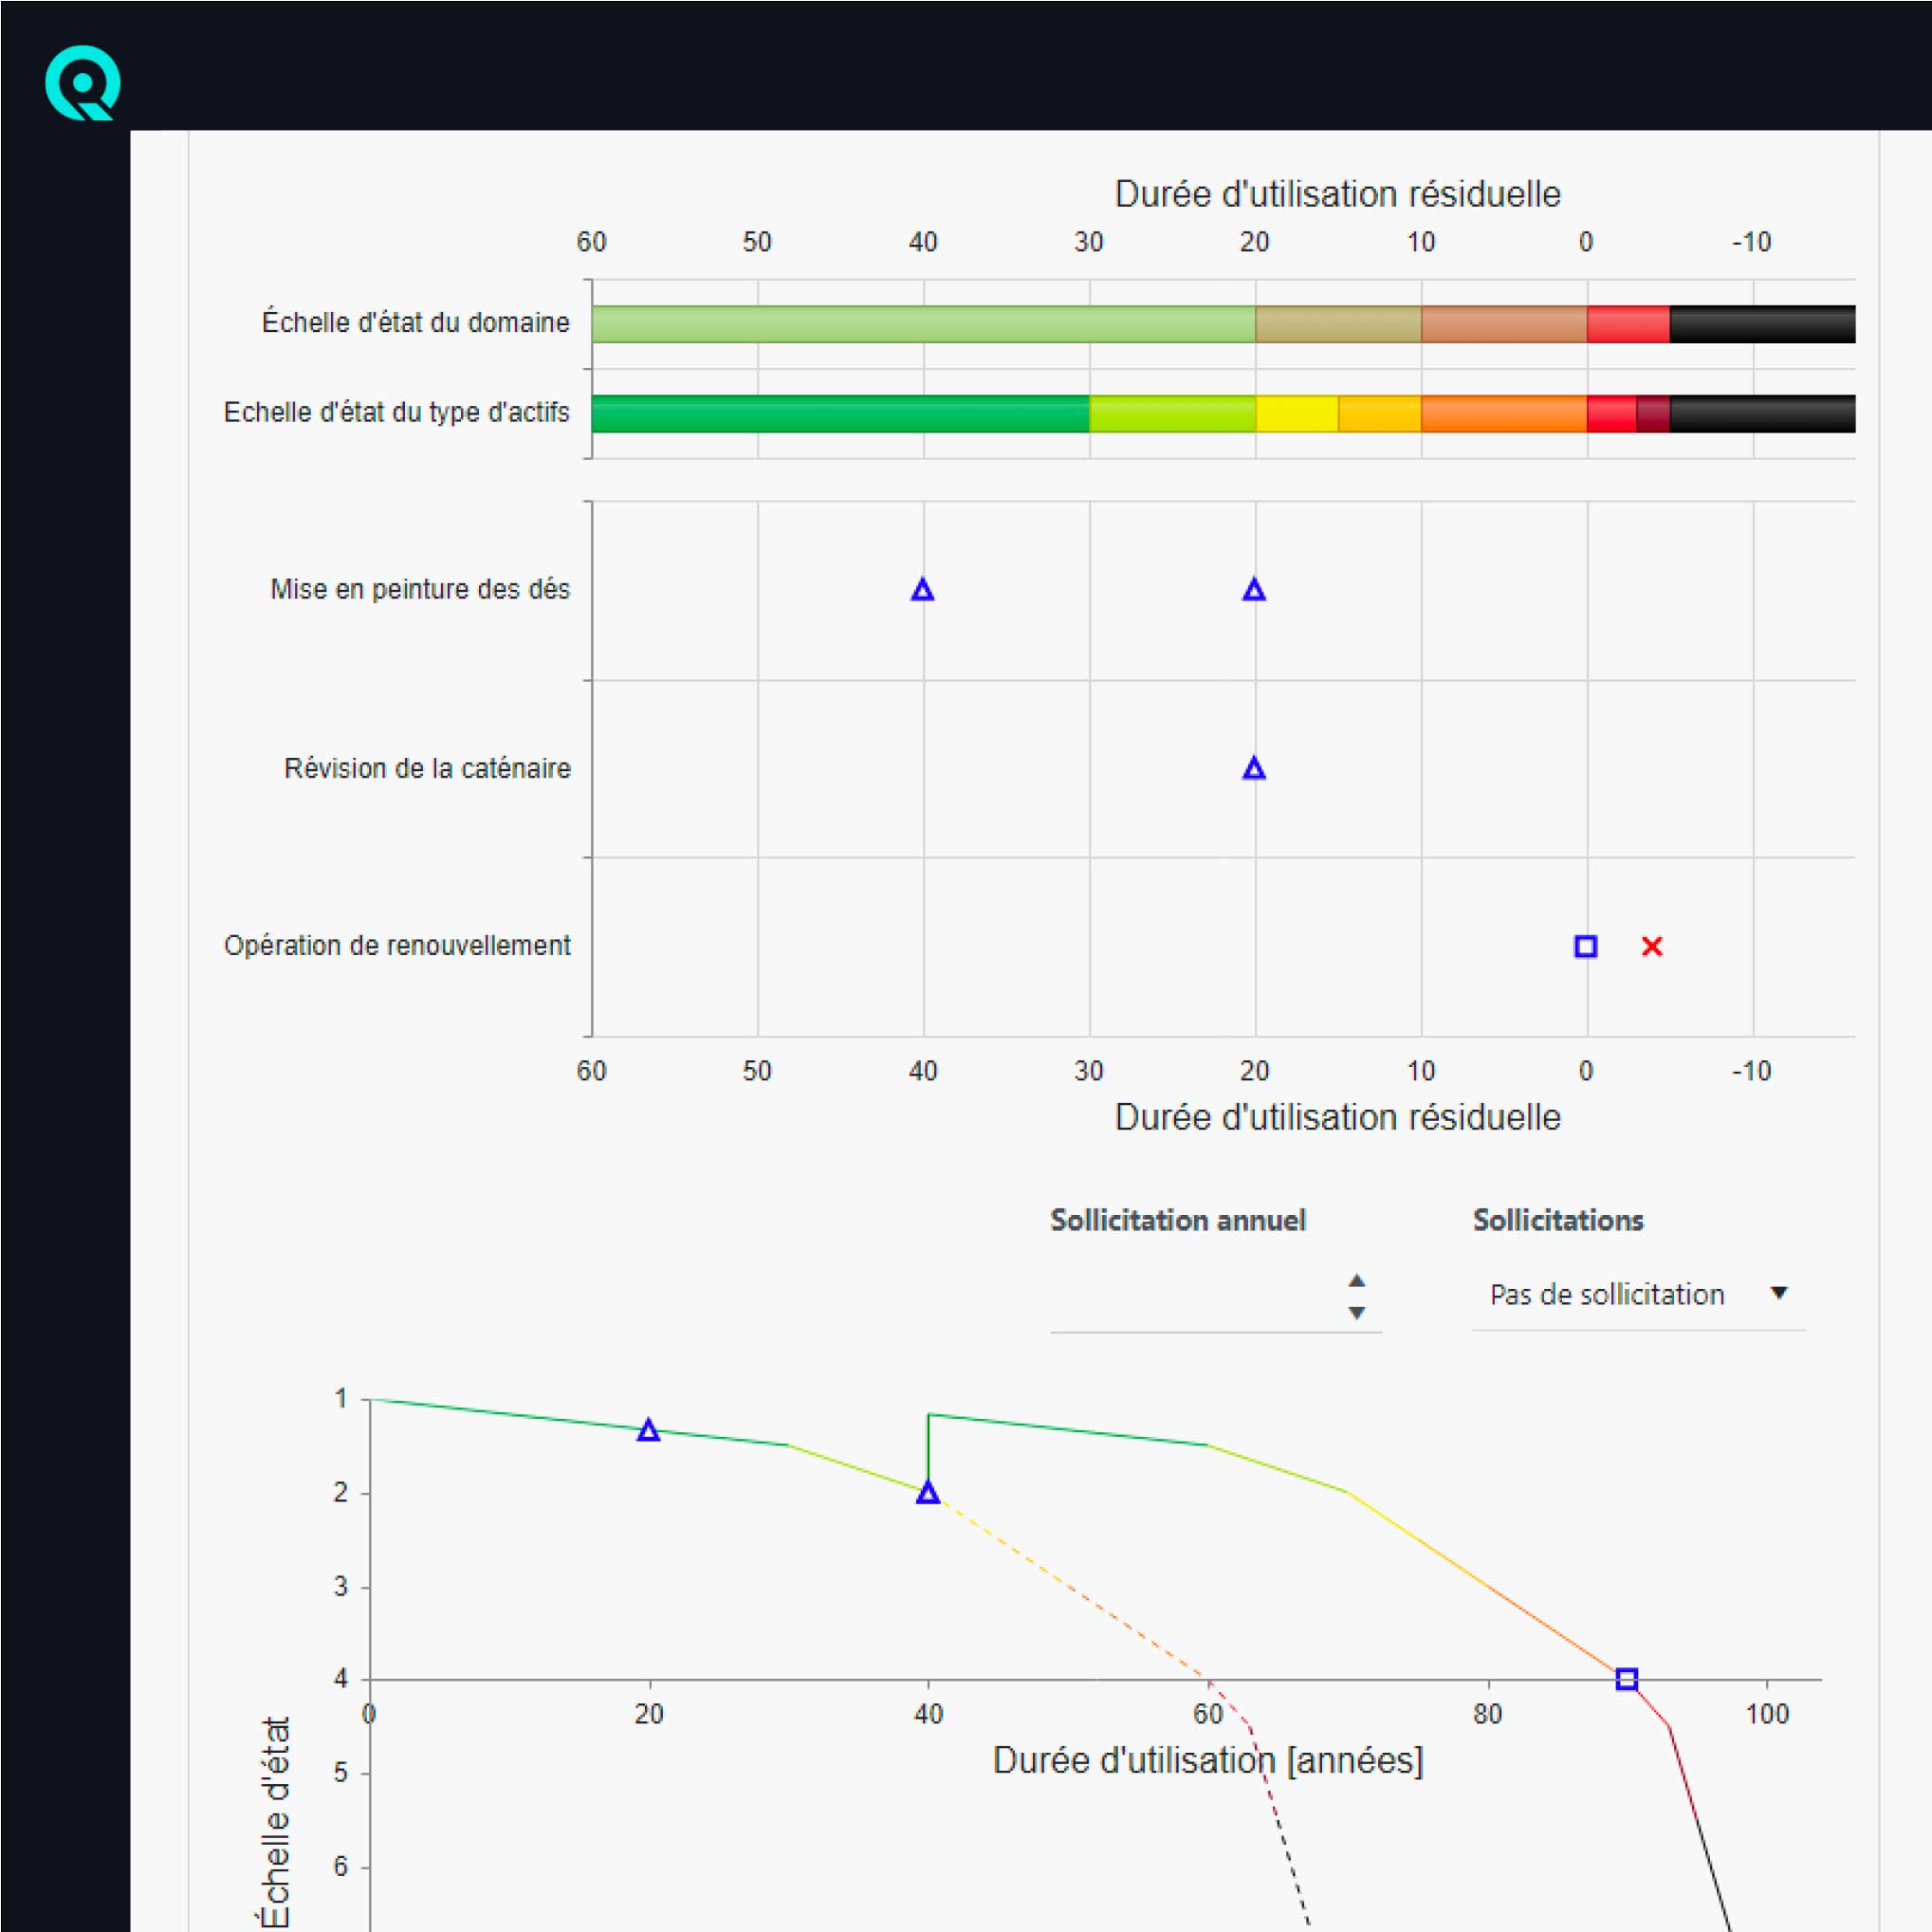
Asset strategies
- Development of optimised lifecycle strategies including rehabilitation, periodic maintenance (CapEx) and routine maintenance (OpEx)
- Modelling of changes in the condition and level of risk of assets, ideal for assets that wear out, such as engineering structures, rail permanent way (tracks and switches), pavements or electromechanical equipment
- Modelling according to the age and risk level of the assets, ideal for assets with electrical, electronic or electromechanical obsolescence
- Consideration of the impact of changes in stress on the life cycle of assets
- Choice of customised status scales in line with certain standards such as RTE 29’900 (railways, Switzerland) or management regulations specific to asset families
- Modelling and simulation of several maintenance and rehabilitation strategies by asset type
- Modelling the impact of ageing assets on maintenance requirements and modelling the impact of insufficient maintenance on ageing assets (reduced service life).
- Modelling of product policies driving technological or configuration changes, as well as systemic links between assets (worksites clusters, induced renewal, etc.).
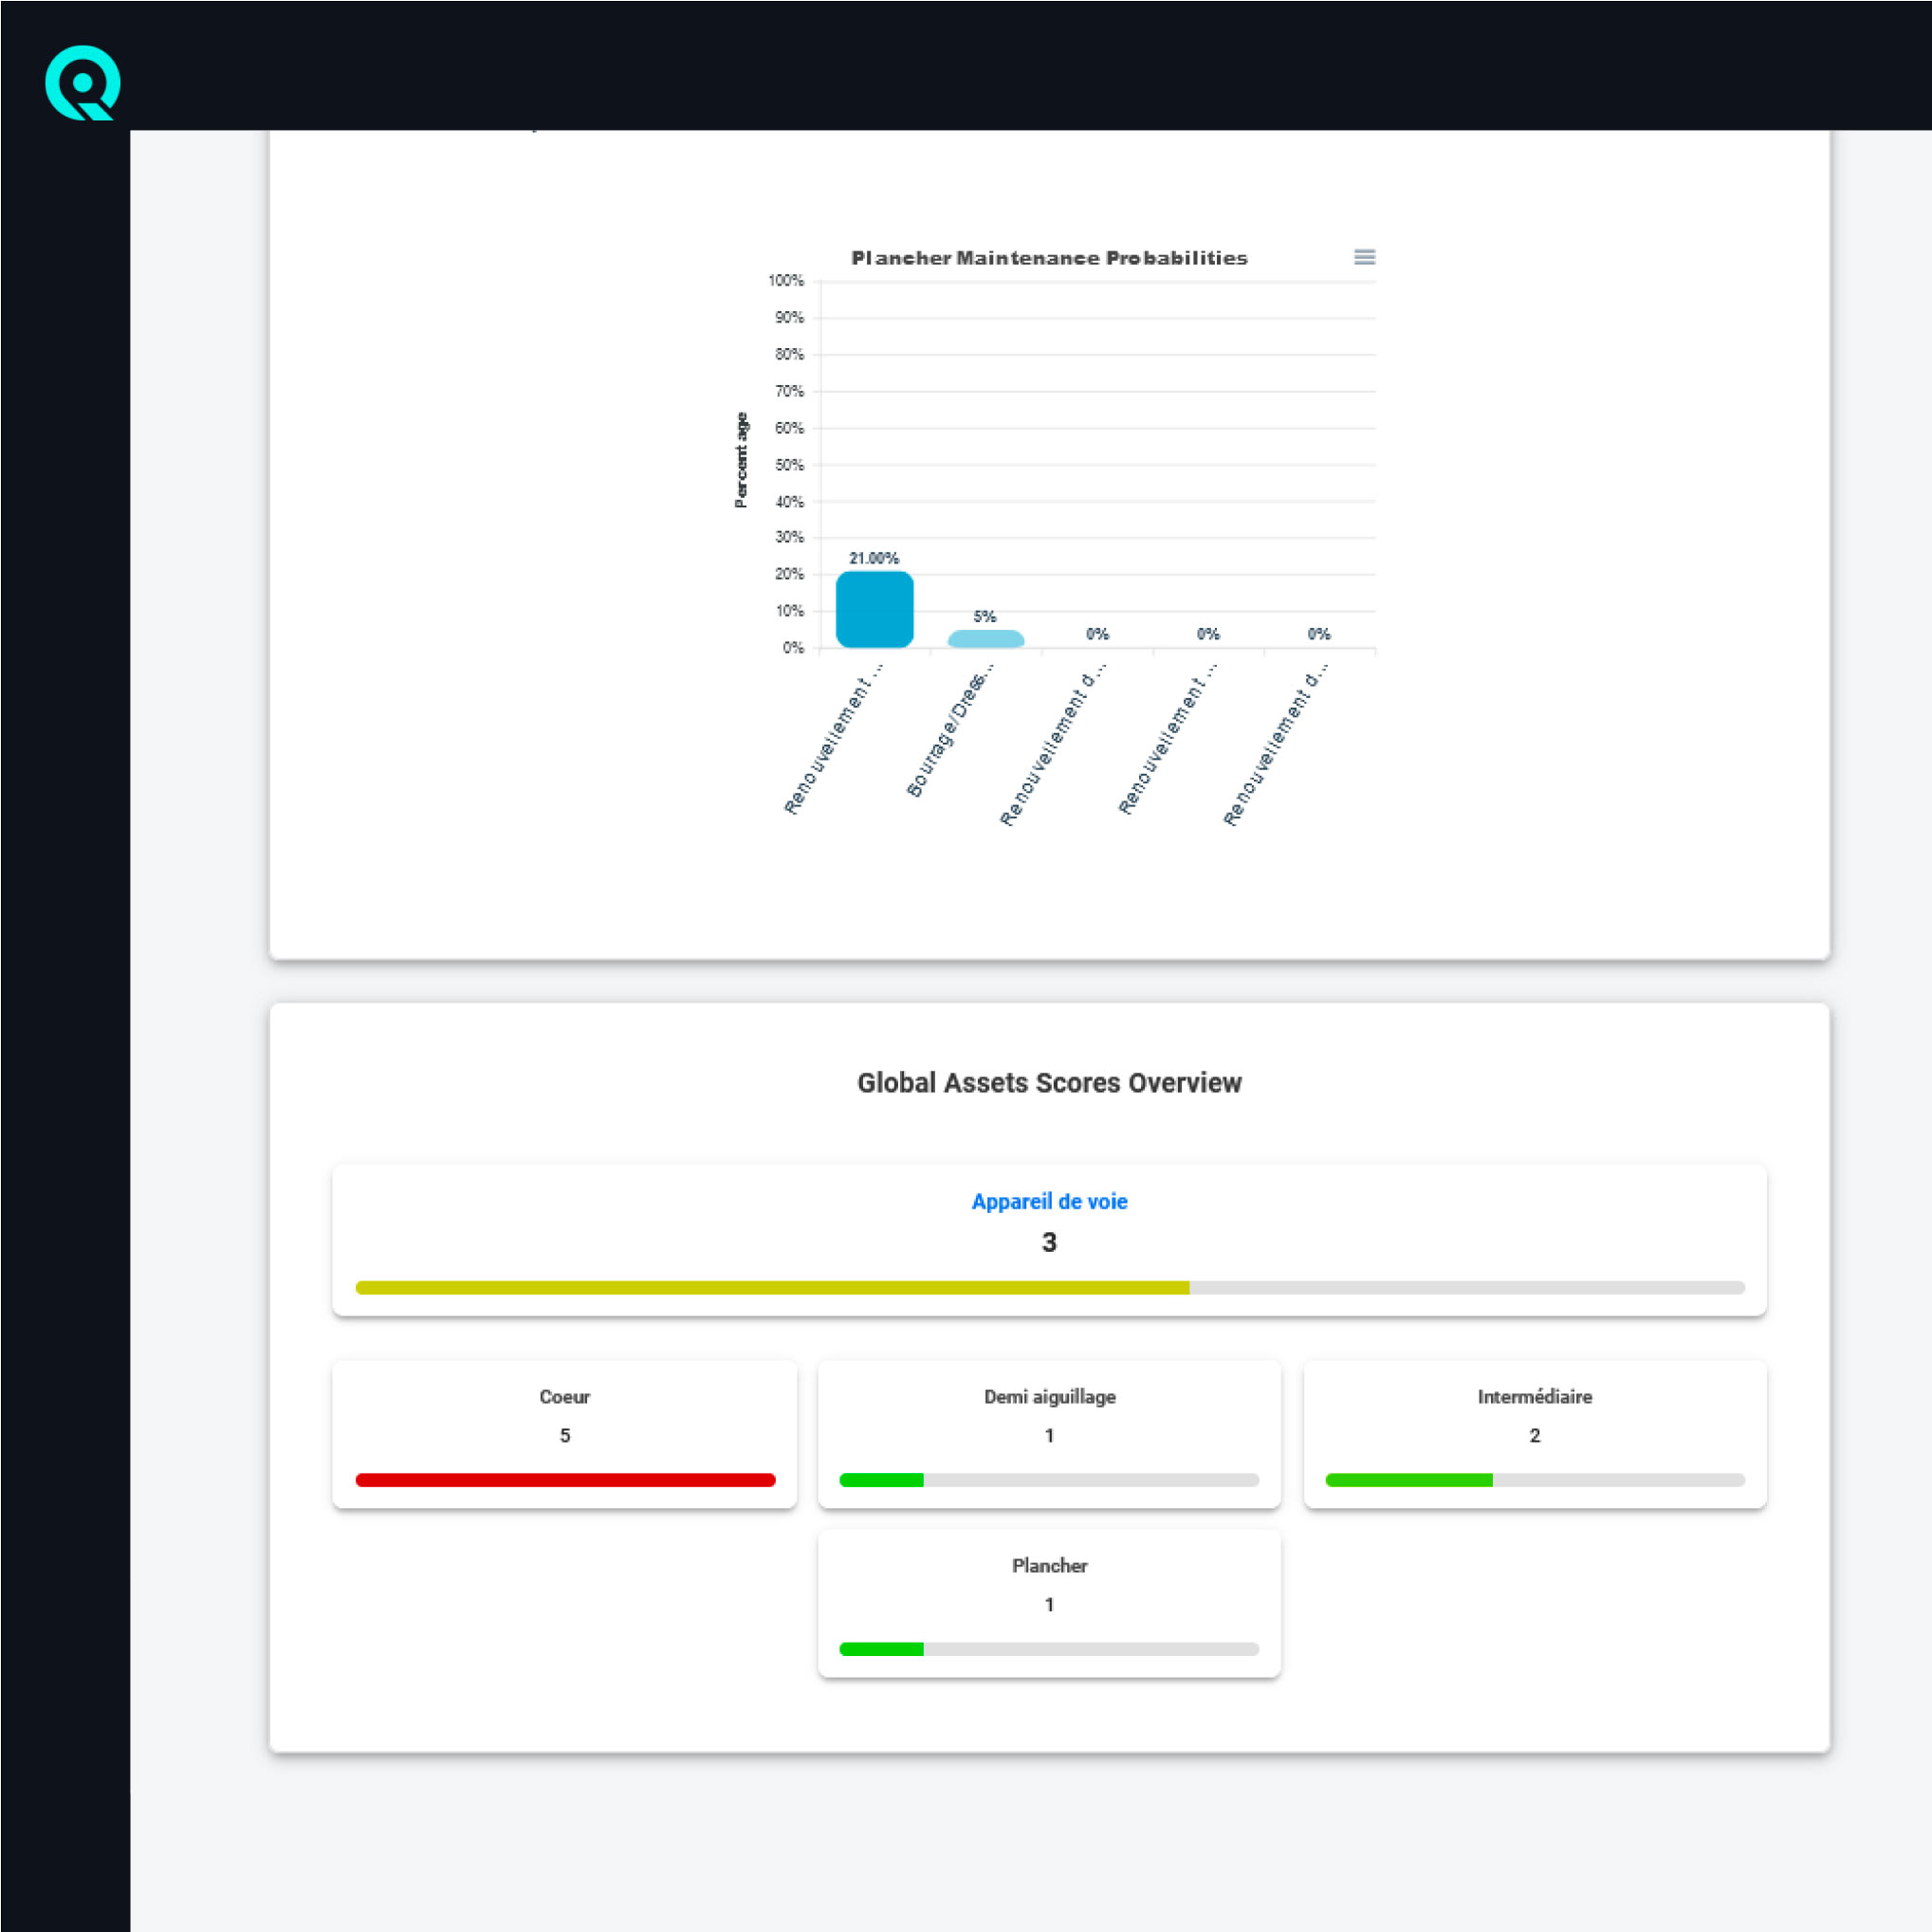
Condition diagnosis
- Making the most of data from automated or semi-automated measurements (sensors, IoT, measurement trains, etc.) to qualify the condition of an asset
- Combining human expertise (from the field) with data from infrastructure or environmental measurements to turn them into decision variables at different timescales.
- Short-term decision support for urgent operations

Scenarios and prioritisation
- Modelling of budget scenarios, with the possibility of integrating several sources of funding, whether from investment (CapEx) or the operating budget (OpEx).
- Modelling of multiple types of industrial resources, such as the annual capacity for carrying out works, the number of technicians and engineers, the number of work windows (in rail), the number of maintenance vehicles, the volume of stocks, etc.
- Consideration of maximum and minimum constraints on resources
- Choice of a uniform scale of risks (status – importance) enabling a hierarchy (or sequencing) to be established between assets and between operations
- Weighting of issues such as availability, safety and environmental sustainability when prioritising operations
- Simulation of work requirements and nominal financial resources (budgets) to ensure long-term network availability and maintain a high level of safety over the long term
- Simulation constrained by available budgetary and industrial resources, with operations prioritised according to risk
- Optimisation of long-term renewals trajectories (“smoothing” of volumes) in order to stabilise volumes and improve industrial efficiency and effectiveness.
- Easy export in Excel format of the projected programme of operations (log file) and changes in the status of each asset
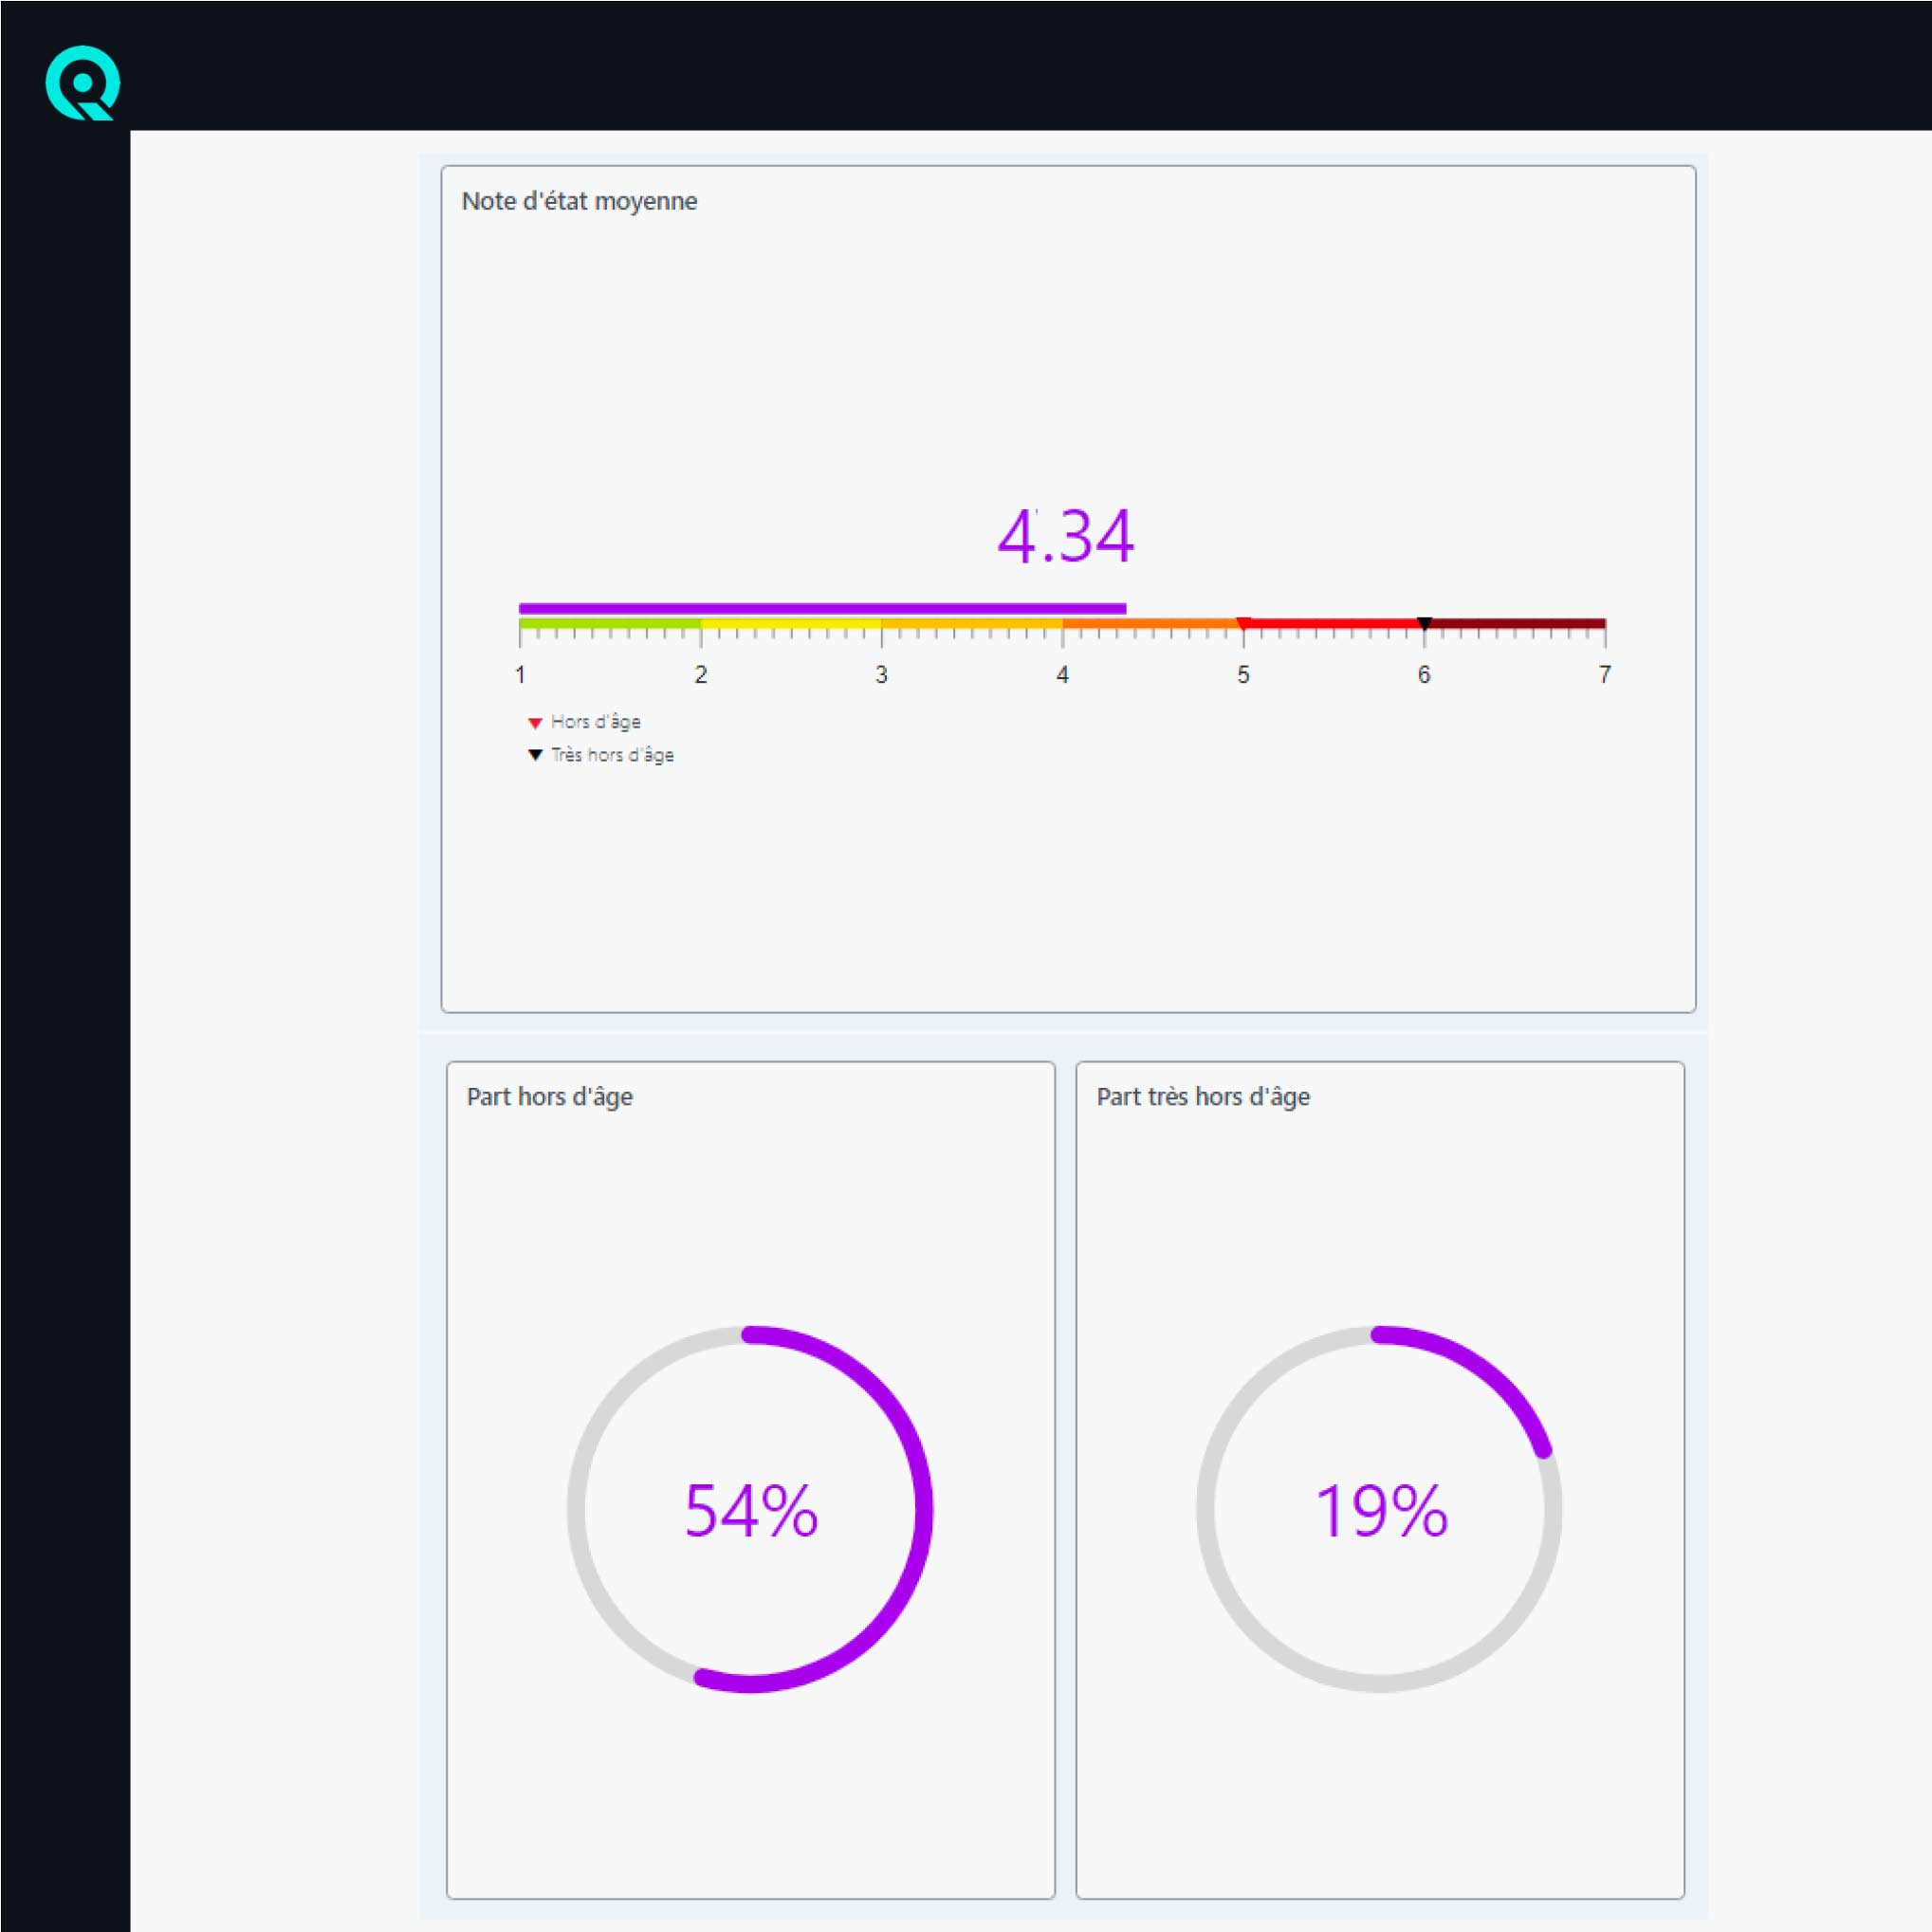
Current network status and performance indicators (BI)
- Key indicators linked to certain legal requirements such as the report on the state of the network (Switzerland)
- Visualisation of indicators such as replacement and residual values, age pyramids (absolute, residual and relative), average ages, breakdown by condition class, average condition, volume of assets to be treated (out-of-age portion), volume of assets associated with a high risk of default, breakdown by risk level, etc.
- View indicators in the form of graphs, geolocalised maps and data tables
- Values expressed in financial and technical terms
- Easy export in Excel or image format of status, performance and risk information for each asset
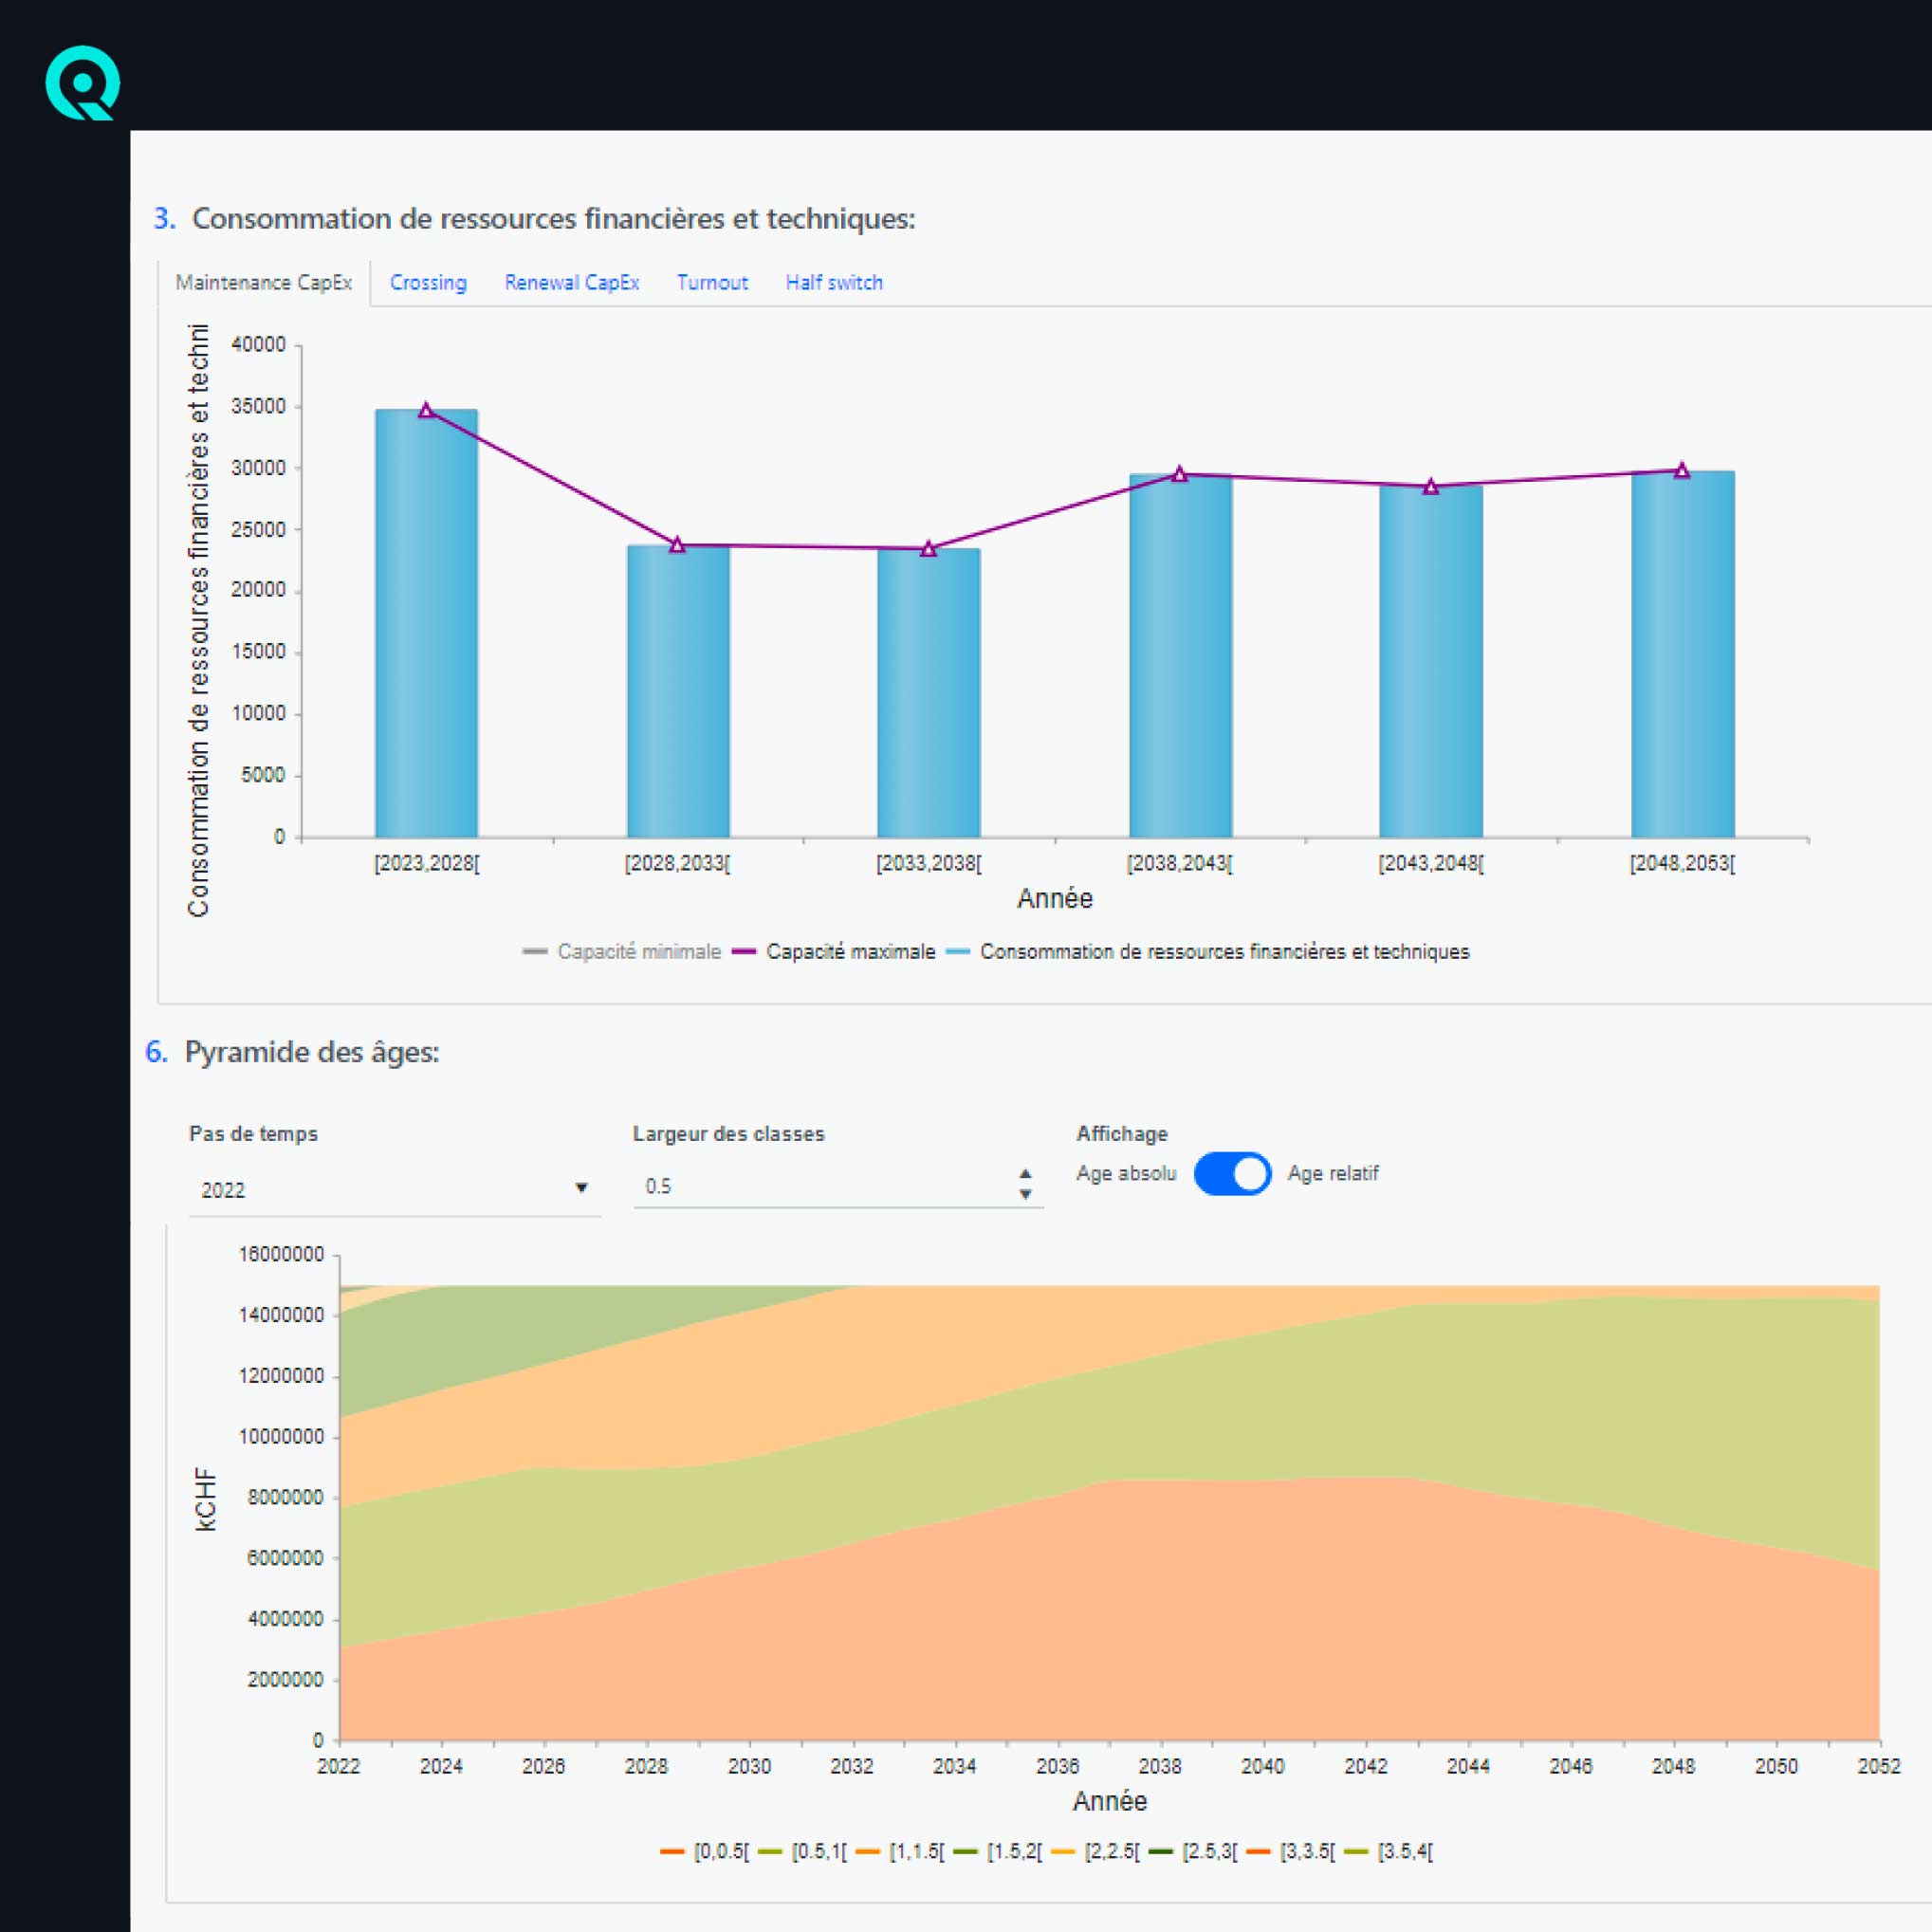
Changes in network status and performance indicators (BI)
- Display of changes in the key indicators for steering the fleet strategy (see above) over the entire simulation period
- Comparison of trends between several scenarios
- Visualisation of the provisional programme for the consumption of financial and technical resources to show how the available resources are being used
- Visualisation of asset trajectories to assess the efficiency of a scenario and the deviation from the objectives (financial, safety, availability, environmental, etc.).
- Easy export in Excel format of the projected programme of operations (log file) and the evolution of the status of each asset
Intégration & personnalisation (BI)
- Liaisons entre les modules Eqylibr et votre BI en un clic.
- Mise à disposition de vues BI préconfigurées, intégrées ou non dans votre environnement.
- Possibilité de personnaliser sans limites les vues BI.
- Intégration automatisée des scénarios et des indicateurs d’asset management dans vos processus.
A demonstration is better than a long speech.
Find out how Eqylibr® can simplify your day-to-day challenges.